ps aux shows you what is running on your system, but witr goes a step further and tells you why it is running by tracing where it came from.If you’ve ever looked at ps aux late at night trying to figure out why a Node.js process is using too much memory, you’ve probably seen the PID, user, and command, but that still doesn’t answer the real questions: who started it, what started it, and why is it still running?
To find that out manually, you usually end up running multiple commands like systemctl status, lsof, ss -tlnp, and digging into /proc/<pid>/ just to piece everything together.
witr simplifies this, as it takes a process name, PID, or port number and shows you the full story in one place. It traces the process from systemd all the way down to the running process, so you can quickly understand why it exists.
Installing witr in Linux
The fastest way to install witr on Linux is by using the official install script, just run the following curl command with sudo so it can install the binary into /usr/local/bin and make it available system-wide:
curl -fsSL https://raw.githubusercontent.com/pranshuparmar/witr/main/install.sh | sudo bash
This script automatically detects your Linux distribution and CPU architecture, then downloads and installs the correct version of witr. It also installs the man page so you can access the documentation using:
man witr
Once installed, confirm it’s working:
witr --version
Output:
witr v0.3.2 (commit 5feece67c5e1ec6680ae0056daba07aa65158cb3, built 2026-05-16T17:41:51Z)
Trace a Process by Name in Linux
The most common way to use witr is by passing a process name, which will find the matching process and show you its full history in one view.
witr node
Or
witr --exact node
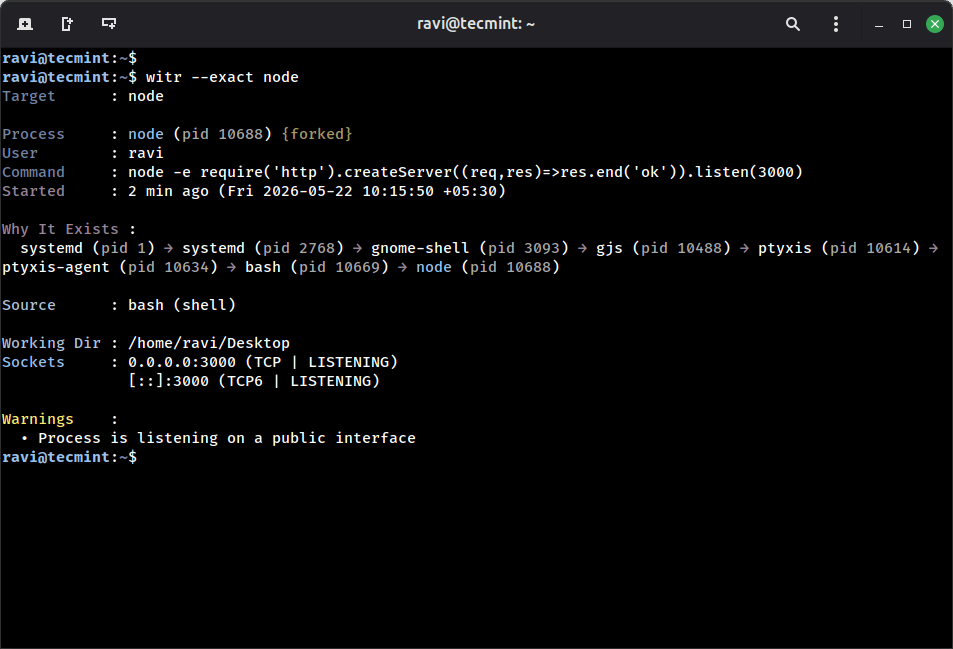
This output replaces several manual checks you would normally do. The most important part is the Why It Exists line, which shows the full chain from systemd (the system init process) down to your node process. This helps you understand exactly how the process was started.
The Source: bash (shell) line tells you it was launched manually from a terminal, not started by a service or background daemon. The Working Dir shows where it was executed, and Sockets shows what network ports it is using.
The warning section helps you quickly spot potential issues, like exposing a service on a public interface.
If multiple processes match the same name (for example nginx often has several worker processes), witr will list them and ask you to narrow it down using:
witr --pid <pid>
You can also use --exact to match only the exact process name instead of partial matches.
systemctl, ps, and lsof output to answer this question, who does the same thing.Find Which Process Is Using a Port in Linux
If something is listening on a port and you want to know what it is and why it is running, you can use the --port option:
witr --port 3000
Output:
Target      : node

Process     : node (pid 10688) {forked}
User        : ravi
Command     : node -e require('http').createServer((req,res)=>res.end('ok')).listen(3000)
Started     : 8 min ago (Fri 2026-05-22 10:15:50 +05:30)

Why It Exists :
  systemd (pid 1) → systemd (pid 2768) → ptyxis (pid 10614) → ptyxis-agent (pid 10634) → bash (pid 10669) → node (pid 10688)

Source      : bash (shell)

Working Dir : /home/ravi/Desktop
Sockets     : 0.0.0.0:3000 (TCP | LISTENING)
              [::]:3000 (TCP6 | LISTENING)

Warnings    :
  • Process is listening on a public interface
It tells you exactly which systemd service started the process, which is very useful when you need to stop the service, change its startup behavior, or debug why it keeps restarting.
Instead of manually tracing with ss, lsof, and systemctl status, witr connects all the dots for you in one view.
Find Linux Process Details by PID
Sometimes you already have a PID from tools like top or ps aux, and you just want to understand the full story behind it.
You can pass it directly using --pid:
witr --pid 10688
Output:
Target      : node

Process     : node (pid 10688) {forked}
User        : ravi
Command     : node -e require('http').createServer((req,res)=>res.end('ok')).listen(3000)
Started     : 13 min ago (Fri 2026-05-22 10:15:50 +05:30)

Why It Exists :
  systemd (pid 1) → systemd (pid 2768) → ptyxis (pid 10614) → ptyxis-agent (pid 10634) → bash (pid 10669) → node (pid 10688)

Source      : bash (shell)

Working Dir : /home/ravi/Desktop
Sockets     : 0.0.0.0:3000 (TCP | LISTENING)
              [::]:3000 (TCP6 | LISTENING)

Warnings    :
  • Process is listening on a public interface
The Source line is especially useful here, which tells you the process was started from an interactive shell, rather than being launched by a system service.
The Listening field shows the network binding. In this case, 0.0.0.0:3000 means the service is exposed on all network interfaces, not just localhost. That’s important to verify in production environments.
A process bound to 0.0.0.0 is reachable from outside the machine if firewall rules allow it, so witr highlights this to help you quickly spot potential exposure risks.
View Linux Process Tree Hierarchyv
If you prefer a clearer visual structure instead of a single-line chain, you can use the –-tree option, which shows the full process hierarchy, including parent, child, and sibling processes:
witr --pid 143895 --tree
Output:
systemd (pid 1)
  └─ systemd (pid 2768)
    └─ ptyxis (pid 10614)
      └─ ptyxis-agent (pid 10634)
        └─ bash (pid 10669)
          └─ node (pid 10688)
This view is especially helpful when debugging services that spawn multiple worker processes. Instead of mentally reconstructing relationships from ps output, you can instantly see the full hierarchy.
The target process is clearly marked in the tree, so it does not get lost among sibling or child processes.
Monitor Multiple Linux Processes at Once
You can also combine multiple inputs in a single command by combining process names, ports, and PIDs together, then runs all lookups and groups the results for you:
witr nginx --port 5432 --pid 1234
Output:
----- [name: nginx] -----
Target      : nginx
Process     : nginx (pid 2311)
...

----- [port: 5432] -----
Target      : postgres
Process     : postgres (pid 891)
...

----- [pid: 1234] -----
Target      : node
Process     : node (pid 1234)
...
This is especially useful during server audits or incident debugging, when you need to inspect multiple services at once. Instead of running separate commands for each process, you get a consolidated view in one place.
It also makes it easier to compare unrelated processes side by side, like a web server, a database, and an application process, without switching context.
Interactive Linux Process Monitor TUI
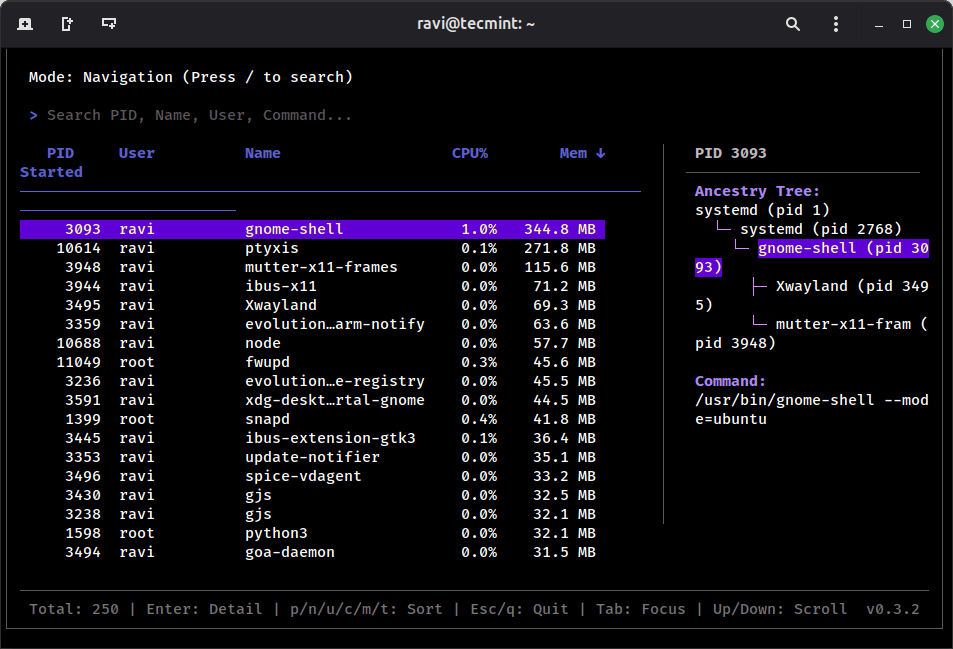
If you run witr without any arguments (or with -i), it opens an interactive TUI (terminal user interface) that shows all running processes in real time.
witr
Inside the TUI, you can browse through processes, sort them by CPU or memory usage, switch between views like process list or port view, and open detailed information for any process. You can also perform actions like sending signals (for example, kill or pause) directly from the interface.
Conclusion
witr fills a real gap in everyday Linux troubleshooting and tools like ps, top, lsof, and ss show you what is running, but they don’t explain why it is running or how it got there.
witr builds that missing context automatically. It traces the full causal chain from systemd or an interactive shell down to the final process, identifies the source supervisor, and highlights useful context like working directory, Git repository, and network bindings. It also flags risky situations such as services exposed on public interfaces.
Since it is read-only and requires no configuration, it is safe to run even on production systems.
A good way to try it is to start with something familiar. For example:
witr --port 80
Run it on a system you manage and see what it reveals. In many cases, the process history is not what you would expect, especially on long-running servers where deployments and restarts leave behind hidden layers of processes.
Have you ever spent 20 minutes tracking down a mystery process only to find out it was a leftover from a deployment 3 days ago? Drop a comment and let me know.