As a Linux expert with over a decade of experience managing servers, I have seen how crucial it is to identify and resolve hard drive bottlenecks to keep a system running smoothly.
Bottlenecks occur when a system’s performance is limited by a specific component, in this case, the hard drive, where slow disk operations can drastically affect the performance of your applications, databases, and even the entire system.
In this article, I will explain how to identify hard drive bottlenecks on Linux using various tools and commands, and what to look for when troubleshooting disk-related issues.
What is a Hard Drive Bottleneck?
A hard drive bottleneck happens when the disk cannot read or write data fast enough to keep up with the system’s demands. This often results in slow response times, lag, and even system crashes in extreme cases.
These bottlenecks are commonly caused by the following factors:
- Overloaded Disk I/O: When the system has too many read/write requests, the disk cannot process them all at once.
- Disk Fragmentation: On certain file systems, files may become fragmented, leading to inefficient disk usage and slower performance.
- Hardware Limitations: Older disks or disks with smaller capacities may not be able to handle modern workloads.
- Disk Errors: Physical problems with the hard drive, such as bad sectors, can also lead to performance issues.
How to Find Hard Drive (Disk) Bottlenecks in Linux
Here are some key Linux commands and tools that can help you identify and diagnose hard drive bottlenecks.
1. iostat (Input/Output Statistics)
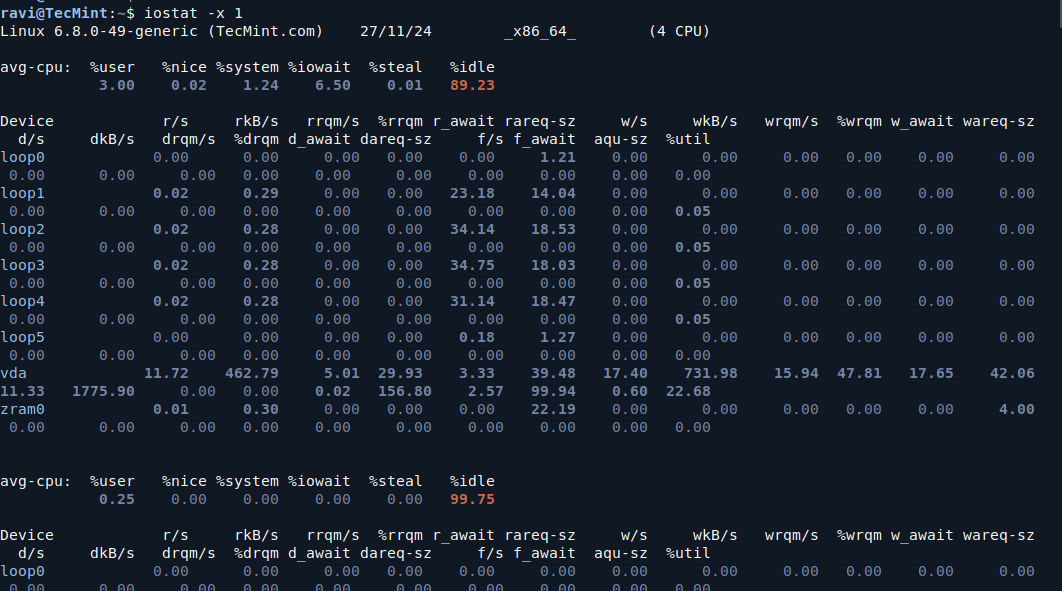
iostat is a command-line utility that provides statistics on CPU and I/O usage for devices, helping you pinpoint disk bottlenecks.
iostat -x 1
Key Metrics to Look For:
%util: This represents how much time the disk was busy handling requests. If this number is consistently high (over 80-90%), it indicates the disk is a bottleneck.await:This is the average time (in milliseconds) for a disk I/O request to complete. A high value indicates slow disk performance.svctm: This represents the average service time for I/O requests. A high value means the disk is taking longer to respond.
2. iotop (I/O Monitoring in Real Time)
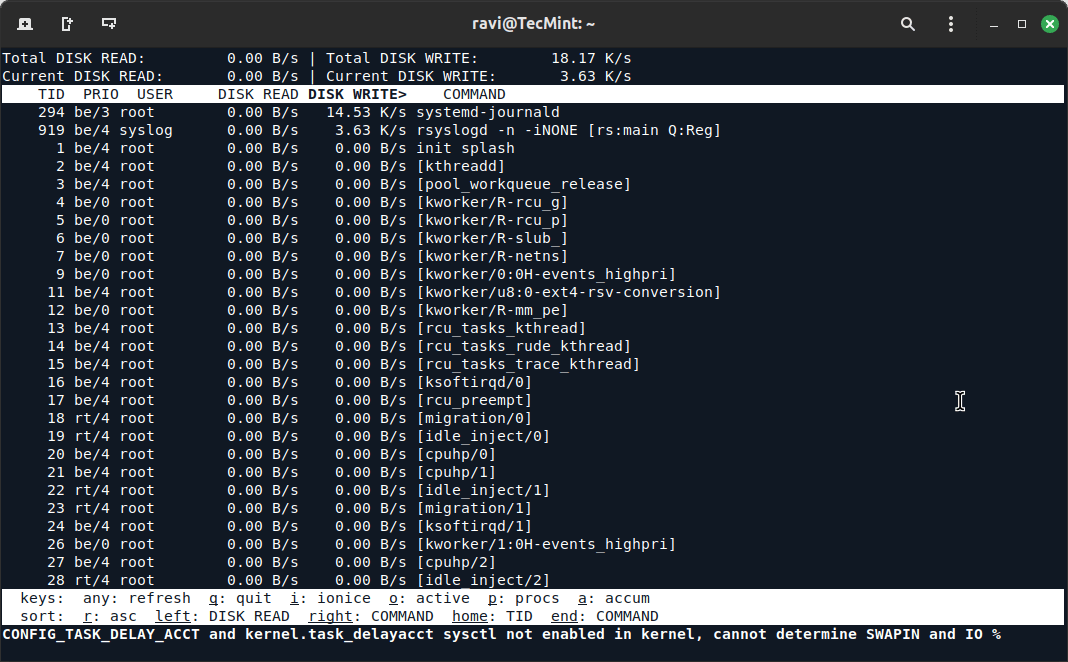
iotop is a real-time I/O monitoring tool that displays processes and their disk activity, which is useful for identifying which processes are consuming excessive disk bandwidth.
sudo iotop
This will show a list of processes that are performing disk I/O, along with the I/O read and write statistics.
Key Metrics to Look For:
- Read/Write: Look for processes that have high read or write values. These processes might be causing the disk bottleneck.
- IO Priority: Check if any process is consuming disproportionate I/O resources. You can adjust the priority of processes using ionice to manage how they interact with disk I/O.
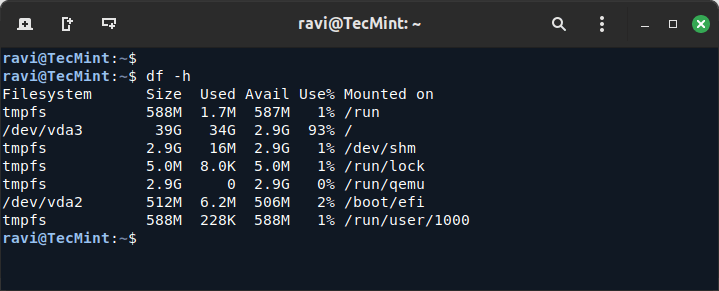
3. df (Disk Free)
df command shows the disk space usage on all mounted filesystems. A nearly full disk can cause significant slowdowns, especially on the root or home partitions.
df -h
Ensure that disks, especially the root (/) and home (/home) directories, are not close to being full. If the disk is more than 85-90% full, it may start to slow down due to lack of space for temporary files and disk operations.
4. dstat (Comprehensive System Resource Monitoring)
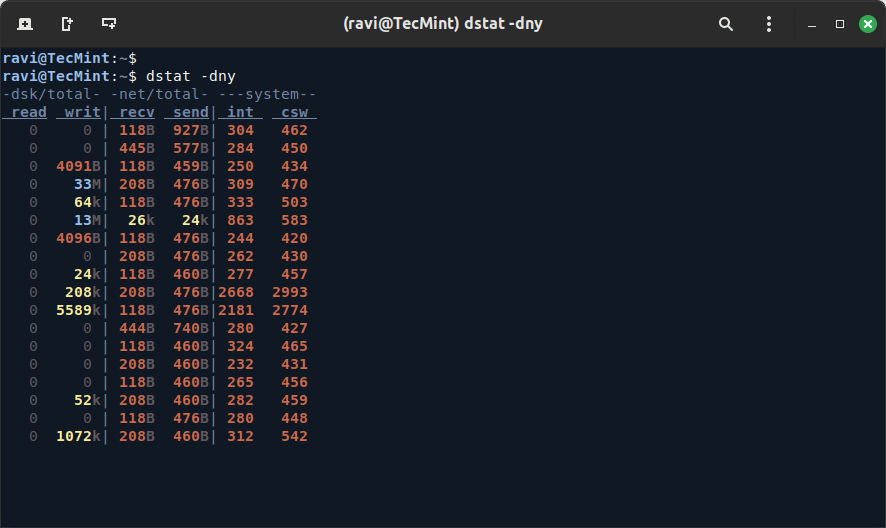
dstat is a versatile tool for monitoring various system resources, including disk I/O, which provides a comprehensive overview of the system’s performance in real-time.
dstat -dny
Key Metrics to Look For:
- disk read/write: Look for spikes in disk read/write activity. If you see constant heavy disk activity, it could indicate a bottleneck.
- disk await: Shows how long each I/O operation takes. Long waits here mean a disk bottleneck.
5. sar (System Activity Report)
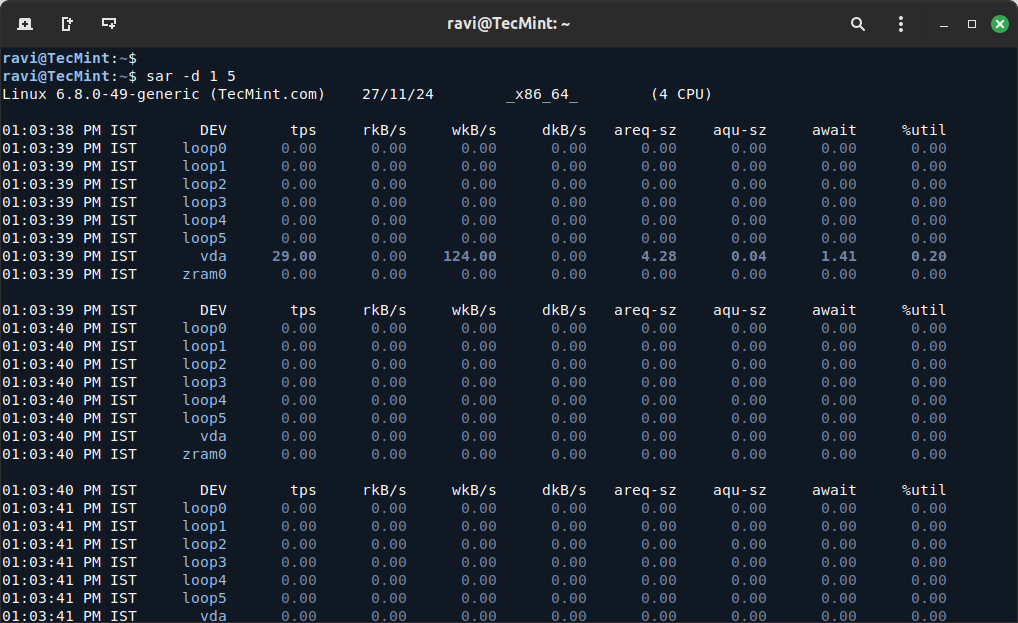
The sar command is a powerful tool that collects, reports, and saves system activity information, which is ideal for historical performance analysis.
sar -d 1 5
Key Metrics to Look For:
- tps: The number of transactions per second. A high value suggests the disk is handling a large number of I/O requests.
- kB_read/s and kB_wrtn/s: The rate of data being read or written. If these numbers are unusually high, it may indicate a bottleneck.
6. smartctl (S.M.A.R.T. Monitoring)
smartctl is used for checking the health of your hard drives by querying the S.M.A.R.T. (Self-Monitoring, Analysis, and Reporting Technology) status.
This can help identify physical issues with the disk, such as bad sectors or failing components.
sudo apt install smartmontools
sudo smartctl -a /dev/sda
Key Metrics to Look For:
- Reallocated_Sector_Ct: The number of sectors that have been reallocated due to errors. A high value indicates the disk might be failing.
- Seek_Error_Rate: High values suggest the disk may be having trouble seeking data, often a sign of physical damage.
7. lsblk (List Block Devices)
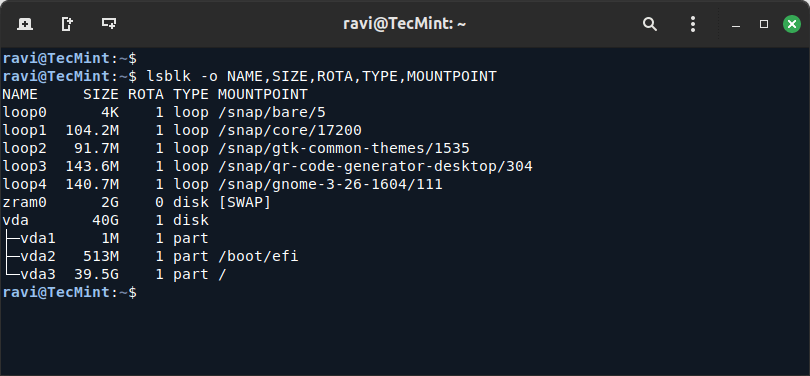
lsblk command lists all block devices on your system, such as hard drives and partitions, which is useful for getting an overview of your system’s storage devices.
lsblk -o NAME,SIZE,ROTA,TYPE,MOUNTPOINT
Ensure that your hard drives or partitions are not overloaded with too many tasks. SSDs (non-rotational) typically offer better performance than HDDs (rotational), and an overused rotational disk can lead to performance bottlenecks.
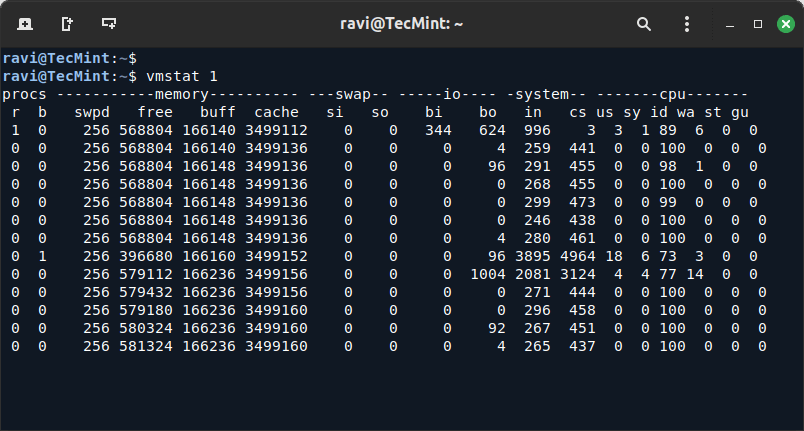
8. vmstat (Virtual Memory Statistics)
While vmstat primarily shows memory usage, it can also provide insight into disk I/O operations and how the system handles memory swapping.
vmstat 1
Key Metrics to Look For:
- bi (blocks in): The number of blocks read from disk.
- bo (blocks out): The number of blocks written to disk.
- si and so (swap in and swap out): If these values are high, it means the system is swapping, which can be caused by insufficient RAM and heavy disk usage.
Conclusion
Hard drive bottlenecks can be caused by various factors, including overloaded disk I/O, hardware limitations, or disk errors. By using the tools and commands outlined in this article, you can effectively diagnose disk-related issues on your Linux system.
Monitoring tools like iostat, iotop, and dstat provide valuable insights into disk performance, while tools like smartctl can help you identify potential hardware failures.
As a seasoned Linux professional, I recommend regularly monitoring disk performance, especially in production environments, to ensure optimal system performance. Identifying and resolving bottlenecks early can save you from performance degradation and system downtime.

