When you’re managing a Linux server, especially one with multiple users, you need visibility into what’s happening on your system, such as who’s logged in? What commands are they running? how much CPU time is being consumed? These aren’t just curiosity questions; they’re essential for security, troubleshooting, and resource management.
psacct and acct are both open source utilities for monitoring users’ activities on the Linux system. These utilities run in the background and keep track of each user’s activity on your system as well as what resources are being consumed.
I personally used these tools in our company, we have a development team where our developers continuously work on servers. So, these are the best utilities to keep an eye on them.
These programs provide an excellent way to monitor what users are doing, what commands are they executing, how many resources are being consumed by them, and how long users are active on the system. Another useful feature is, that it gives total resources consumed by services like Apache, MySQL, FTP, SSH, etc.
I think this is one of the great and most needed utilities for every Linux/Unix System Administrator who wants to keep a track of user activities on their servers/systems.
What These Tools Actually Do
The psacct or acct package provides several features for monitoring process activities:
accommand prints the statistics of user logins/logouts (connect time) in hours.lastcommcommand prints the information of previously executed commands of the user.acctoncommands is used to turn on/off process for accounting.sacommand summarizes information of previously executed commands.lastandlastbcommands show a listing of last logged-in users.
Installing psacct or acct Packages in Linux
psacct and acct are both similar packages, and there is not much difference between them, but the psacct package is only available for rpm-based distributions such as RHEL, CentOS, and Fedora, whereas the acct package is available for Debian-based distributions like Ubuntu and Linux Mint.
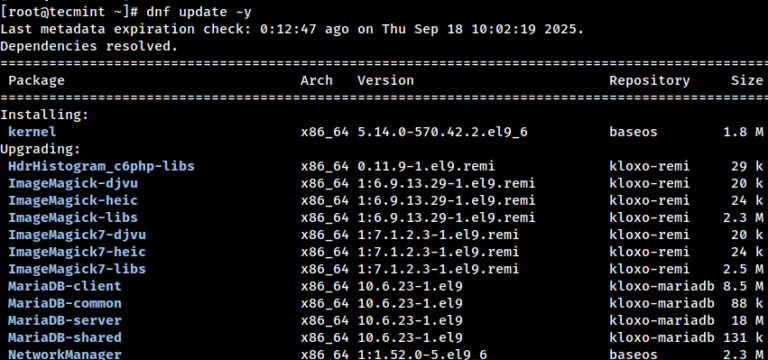
To install the psacct package under rpm-based distributions, issue the following yum or dnf command:
sudo yum install psacct
# Or on newer systems
sudo dnf install psacct
To install the acct package using the apt command under Debian-based distributions:
sudo apt install acct
On other Linux distributions, you can install it as shown:
sudo apk add psacct          [On Alpine Linux]
sudo pacman -S acct          [On Arch Linux]
sudo zypper install acct     [On OpenSUSE]
Starting psacct or acct Service
By default, the psacct service is in disabled mode, and you need to start it manually under RHEL-based distributions, using the following command to check the status of the service:
sudo systemctl status psacct
You see the status showing as disabled, so let’s start it manually using the following commands, which will create a /var/account/pacct file:
sudo systemctl start psacct
sudo systemctl enable psacct
sudo systemctl status psacct
Under Debian-based distributions, the service is started automatically; you don’t need to start it again.
Display Statistics of Users Connect Time
ac command without specifying any argument will display total statistics of connect time in hours based on the user logins/logouts from the current wtmp file:
ac

total     11299.15
This tells you the cumulative hours all users have been connected to your system, which is useful for capacity planning and understanding usage patterns.
Display Statistics of Linux Users Day-Wise
Using the command "ac -d" will print out the total login time in hours by day-wise:
ac -d
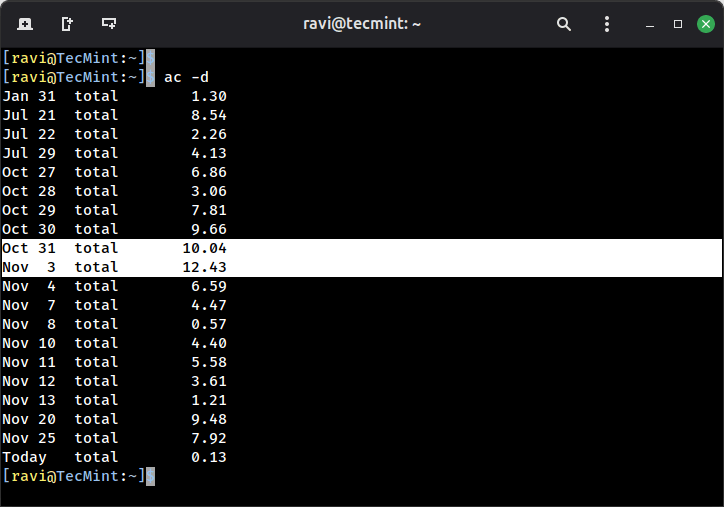
Notice the spike on Oct 31 and Nov 3, if you see unusual patterns like this, it’s worth investigating what caused the increased activity.
Display Total Login Time of All Linux Users
Using the command “ac -p" will print the total login time of each Linux user in hours:
ac -p
Sample Output:
rockylinux                         425.61
tecmint                            702.29
root                             10171.54
total    11299.44
Here, you can see that root has been logged in significantly more than other users, which might be normal for your environment or might indicate you need to delegate more tasks to non-root users.
Display Linux User Login Time
To get the total login statistics time of user “ravi” in hours, use the command as:
ac ravi

total      110.31
Display Day-Wise Login Time of User
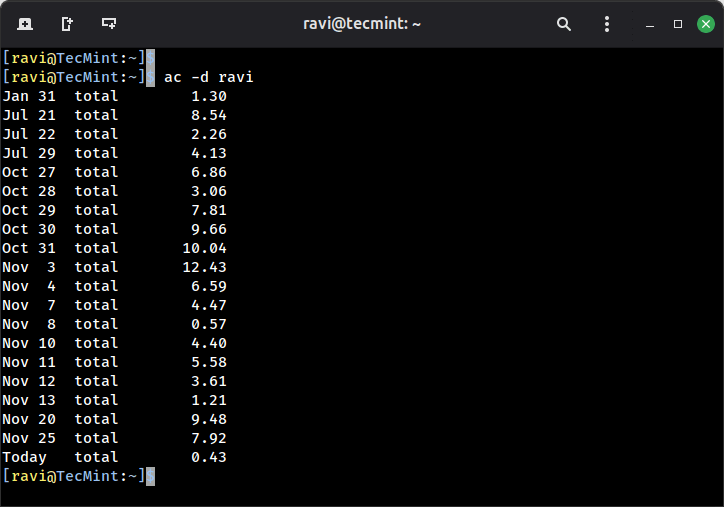
The following command will print the day-wise total login time of user “ravi” in hours:
ac -d ravi
You can also check for a specific time range, for example, to see login times for the current month:
ac -d ravi | tail -n 31
Print All Linux Commands Executed by Users
The "sa" command is used to print the summary of commands that were executed by users:
sa
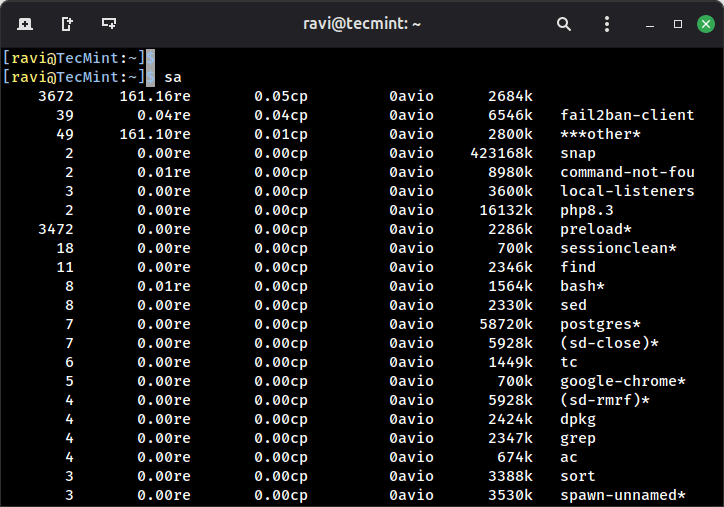
Explanation of the above command output:
- 0.04re is a “real-time” as per wall clock minutes.
- 0.04cp is a sum of system/user time in cpu minutes.
- 6546k is a cpu-time averaged core usage, i.e. 1k units.
- fail2ban-client command name.
The asterisk (*) after some commands indicates that the command was run with superuser privileges.
Print Linux User Information
To get the information of an individual user, use the options -u:
sa -u
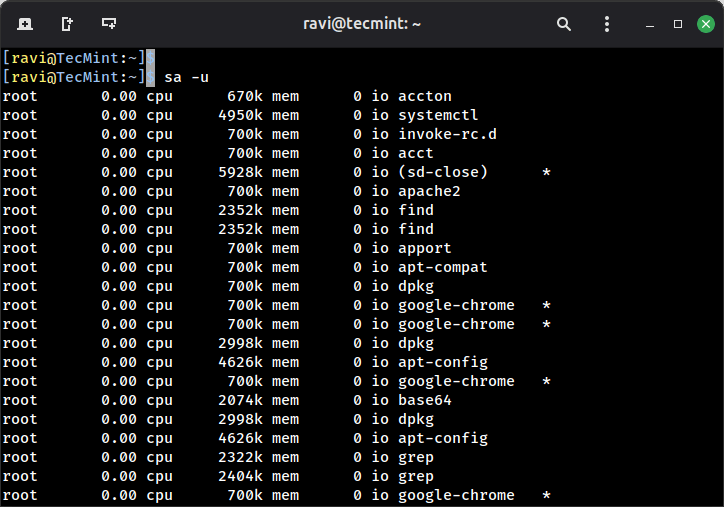
This shows you every command a specific user ran, along with the resources each command consumed.
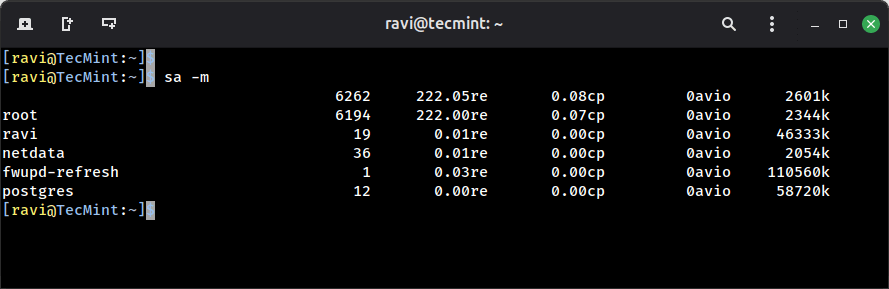
Print Number of Linux Processes
This command prints the total number of processes and CPU minutes. If you see a continued increase in these numbers, then it’s time to look into the system about what is happening:
sa -m
Print and Sort Usage by Percentage
The command "sa -c" displays the highest percentage of users:
sa -c
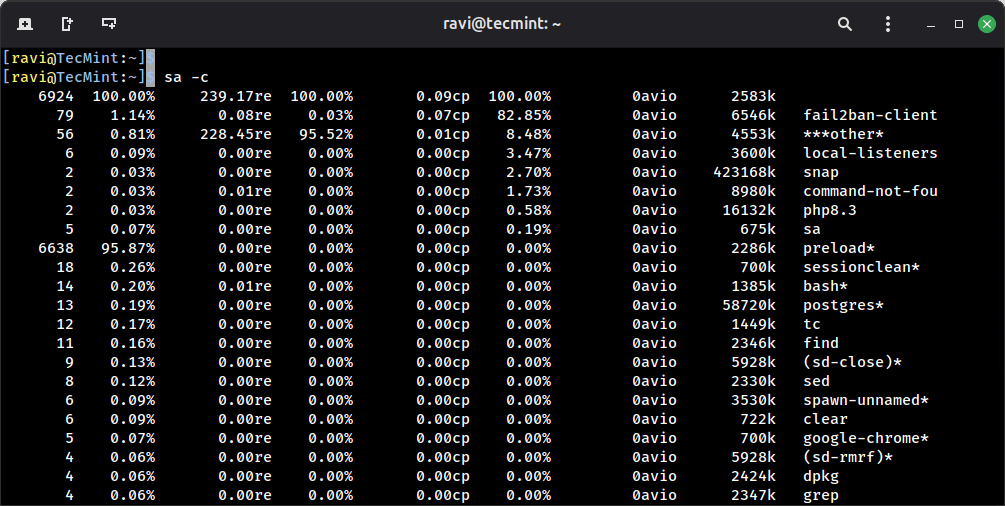
This breakdown helps you identify which commands are consuming the most resources, you can quickly spot if something unusual is taking up more CPU or memory than expected.
List Last Executed Commands of User
The 'lastcomm' command is used to search and display previously executed user command information. You can also search for commands of individual usernames. For example, we see commands of the user (ravi):
lastcomm ravi
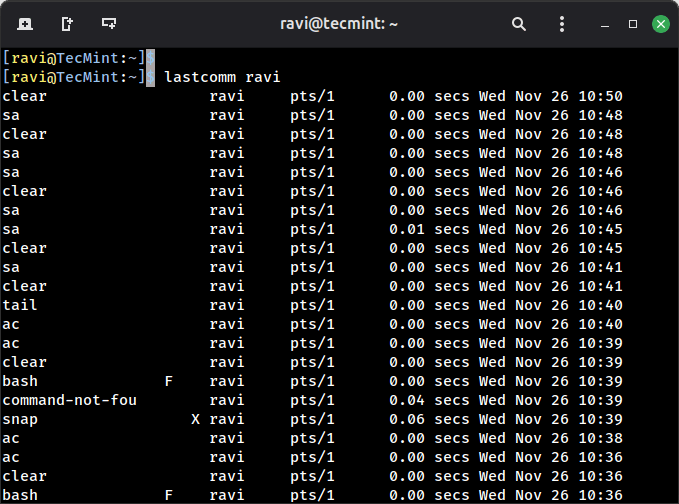
The "F" flag indicates the command forked but didn’t execute (usually shell initialization), which is normal behavior, but good to understand when reviewing logs.
You can also limit the output to show only the most recent commands:
lastcomm tecmint | head -n 20
Search Logs for Commands
With the help of the lastcomm command, you will be able to view the individual use of each command:
lastcomm ls
This is particularly useful when you need to audit who ran specific commands, for instance, if you want to see who’s been accessing sensitive directories:
lastcomm cat | grep -i "shadow|passwd"
Practical Use Cases
Here are some real-world scenarios where these tools become invaluable:
- Tracking Down Resource Hogs: If your server is running slow, use
sa -cto identify which commands are consuming the most CPU time. - Security Auditing: Use
lastcommto review what commands were executed before a security incident, this creates an audit trail that’s harder to tamper with than shell history. - Billing and Usage Reports: For shared hosting environments,
ac -pgives you concrete data on user activity for billing purposes. - Troubleshooting User Issues: When a user says “I didn’t do anything“, you can politely verify what commands were actually executed.
Managing Log Files
These tools generate logs that can grow over time, the main accounting file is located at /var/account/pacct. You can rotate this file using logrotate by creating a configuration file at /etc/logrotate.d/psacct:
/var/account/pacct {
    monthly
    rotate 12
    compress
    notifempty
    create 0600 root root
}
For more information and usage, check out the manual pages of these tools:
man ac
man sa
man lastcomm
man accton
These manuals contain additional options and flags that can help you fine-tune your monitoring to exactly what you need.