Managing Linux servers daily can be fun and stressful, especially when you’re dealing with unexpected downtimes or service failures. One thing I’ve learned in my 15+ years as a Linux sysadmin is this: Prevention is better than a cure.
You don’t want to wait for users to report issues. As a sysadmin, your goal should be to detect problems before they affect users or production workloads.
That’s why I always recommend automating daily health checks for your system. If you know ahead of time that disk space is running low or a service has failed, you can fix it before users start shouting.
In this tutorial, I’ll show you how to:
- Create a simple but powerful Bash script to check critical system health.
- Set it up to run daily with Cron.
- Get the report via email (optional).
This script works perfectly on any popular Linux distribution and is suitable for both personal VPS setups and production environments. While the initial setup takes just 10-15 minutes, it can save you hours of troubleshooting down the line.
What Will the Script Monitor?
Here are the key system health checks we’ll include in the script:
- Disk Usage – to catch low storage before it causes issues.
- CPU Load – to spot unusually high load on the server.
- Memory Usage – to identify memory pressure or leaks.
- Failed Services – to know if any systemd service has crashed or failed silently.
- Top 5 Memory & CPU-Hungry Processes – to find greedy applications.
- System Uptime – to track unexpected reboots.
- Available Package Updates (Optional) – helps keep your system secure and up-to-date.
With this checklist, you’ll get a clear snapshot of your system’s health, every single day automatically.
Step 1: Create the Health Check Script
Create a new file called system-health.sh in your preferred directory, e.g., /opt/scripts.
sudo mkdir -p /opt/scripts
sudo nano /opt/scripts/system-health.sh
Now, copy and paste the following script into it:
#!/bin/bash

# Author: Ravi Saive (Tecmint)
# Description: Simple System Health Check Script

LOGFILE="/var/log/system-health-$(date +%F).log"
HOSTNAME=$(hostname)
DATE=$(date)

{
echo "============================================"
echo " System Health Report for $HOSTNAME"
echo " Generated on: $DATE"
echo "============================================"

# Disk Usage
echo -e "nDisk Usage:"
printf "%-20s %-10s %-10s %-10s %-6s %-sn" "Filesystem" "Size" "Used" "Avail" "Use%" "Mounted on"
df -h --output=source,size,used,avail,pcent,target | tail -n +2

# CPU Load
echo -e "nCPU Load (1/5/15 min average):"
uptime | awk -F'load average:' '{ print "  " $2 }'

# Memory Usage
echo -e "nMemory Usage:"
free -h | awk 'NR==1 || /Mem|Swap/ { printf "  %-10s %-10s %-10s %-10s %-10s %-10sn", $1, $2, $3, $4, $5, $6 }'

# Failed Services
echo -e "nFailed Systemd Services:"
FAILED=$(systemctl --failed --no-legend)
if [ -z "$FAILED" ]; then
    echo "  No failed services."
else
    echo "$FAILED" | while read -r line; do
        echo "  $line"
    done
fi

# Top 5 Memory-Consuming Processes
echo -e "nTop 5 Memory Consuming Processes:"
ps -eo user,pid,%cpu,%mem,command --sort=-%mem | head -n 6 |
awk '{ printf "  %-10s %-6s %-6s %-6s %-sn", $1, $2, $3, $4, substr($0, index($0,$5), 60) }'

# Top 5 CPU-Consuming Processes
echo -e "nTop 5 CPU Consuming Processes:"
ps -eo user,pid,%cpu,%mem,command --sort=-%cpu | head -n 6 |
awk '{ printf "  %-10s %-6s %-6s %-6s %-sn", $1, $2, $3, $4, substr($0, index($0,$5), 60) }'

# Uptime
echo -e "nSystem Uptime:"
echo "  $(uptime -p)"

# Package Updates
echo -e "nAvailable Package Updates:"
if command -v apt &> /dev/null; then
    UPDATES=$(apt list --upgradable 2>/dev/null | grep -v "Listing...")
    if [ -z "$UPDATES" ]; then
        echo "  System is up to date."
    else
        echo "$UPDATES" | awk '{ print "  " $0 }'
    fi
elif command -v dnf &> /dev/null; then
    dnf check-update || echo "  System is up to date."
elif command -v yum &> /dev/null; then
    yum check-update || echo "  System is up to date."
else
    echo "  Package manager not supported."
fi

echo -e "nEnd of Report"

} > "$LOGFILE"

# Optional: Send report via mail (if mail is configured)
MAIL_TO="[email protected]"
if command -v mail > /dev/null 2>&1; then
    mail -s "Daily Health Report for $HOSTNAME" "$MAIL_TO" < "$LOGFILE"
fi
Press CTRL+O, ENTER to save, CTRL+X to exit, and then make the script executable using:
sudo chmod +x /opt/scripts/system-health.sh
Step 2: Test the Script Manually (Before Automating)
Before you let Cron handle the job, it’s a good idea to run the script manually to make sure everything works as expected.
sudo /opt/scripts/system-health.sh
You should see a well-structured report with details about disk usage, CPU load, memory stats, failed services, and more.
cat /var/log/system-health-$(date +%F).log
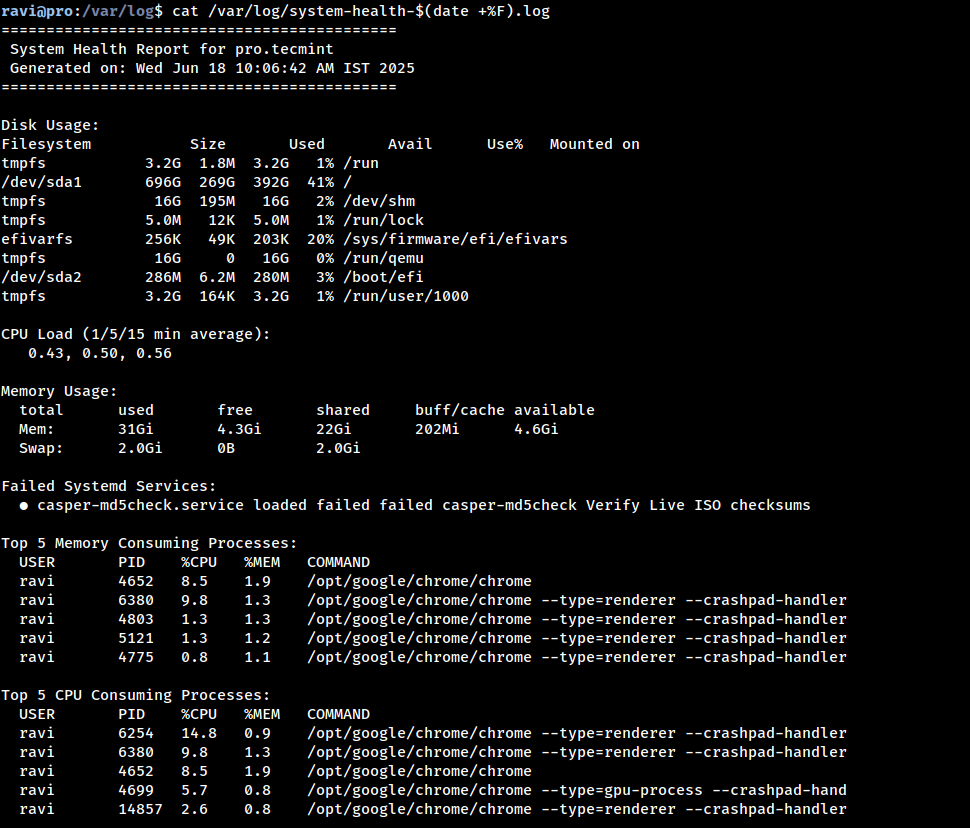
If everything looks good, you’re ready to automate it with Cron.
Step 2: Set Up a Cron Job
Now that your script is ready, it’s time to automate it using cron, a built-in Linux tool that runs tasks at scheduled times.
To run the health check script daily at 7 AM, open the root user’s crontab. As we are checking system-level resources, it’s best to run the script as the root user:
sudo crontab -e
At the bottom of the file, add the following line:
0 7 * * * /opt/scripts/system-health.sh
If you want to save the output or errors of the cron job, you can modify the line like this:
0 7 * * * /opt/scripts/system-health.sh >> /var/log/system-health-cron.log 2>&1
Step 3: Set Up Mail (Optional but Useful)
If you want to receive the report by email, ensure your server can send mail – on most systems, simply installing mailutils is enough.
sudo apt install mailutils -y  [On Debian/Ubuntu]
sudo dnf install mailx -y      [On CentOS/RHEL]
You may also need to configure Postfix or SSMTP to relay emails correctly, especially if you’re on a cloud VM.
Step 4: Displaying System Health in the MOTD (Message of the Day)
One reader had a great idea of displaying a brief version of this health check as a MOTD when logging into your server, which is a smart way to instantly see the system’s health status without running any commands.
Create a lightweight MOTD script and save this script as /etc/update-motd.d/99-system-health.
#!/bin/bash
# Lightweight System Health MOTD
# Author: Ravi Saive (Tecmint)

echo "==== 🩺 System Health: $(hostname) ===="
echo "🕒 Uptime: $(uptime -p)"
echo "💽 Disk: $(df -h / | awk 'NR==2 {print $5 " used on " $6}')"
echo "📊 CPU Load: $(uptime | awk -F'load average:' '{print $2}' | sed 's/^ //')"
echo "🧠 Memory: $(free -m | awk '/Mem:/ {print $3 "MB used / " $2 "MB total"}')"
FAILED=$(systemctl --failed --no-legend | wc -l)
echo "🚨 Failed Services: $FAILED"
echo "====================================="
Make it executable:
sudo chmod +x /etc/update-motd.d/99-system-health
This method works on Ubuntu and Debian-based systems where dynamic MOTD is enabled by default. For other distributions, you can include this script in .bashrc or .bash_profile.
Now every time you SSH into your server, you’ll get a quick overview of your system’s health – no extra steps needed!
==== 🩺 System Health: server01 ====
🕒 Uptime: up 2 days, 4 hours
💽 Disk: 68% used on /
📊 CPU Load: 0.12, 0.21, 0.25
🧠 Memory: 842MB used / 1987MB total
🚨 Failed Services: 0
=====================================
Conclusion
With this Bash script + Cron setup, you can automate daily health checks and get a neat report sent straight to your inbox. No more guessing if your disk is full or if a service quietly failed in the background.
It just works, every single day, and gives you peace of mind.
💬 If you liked this article or have suggestions to improve it, feel free to leave a comment below.